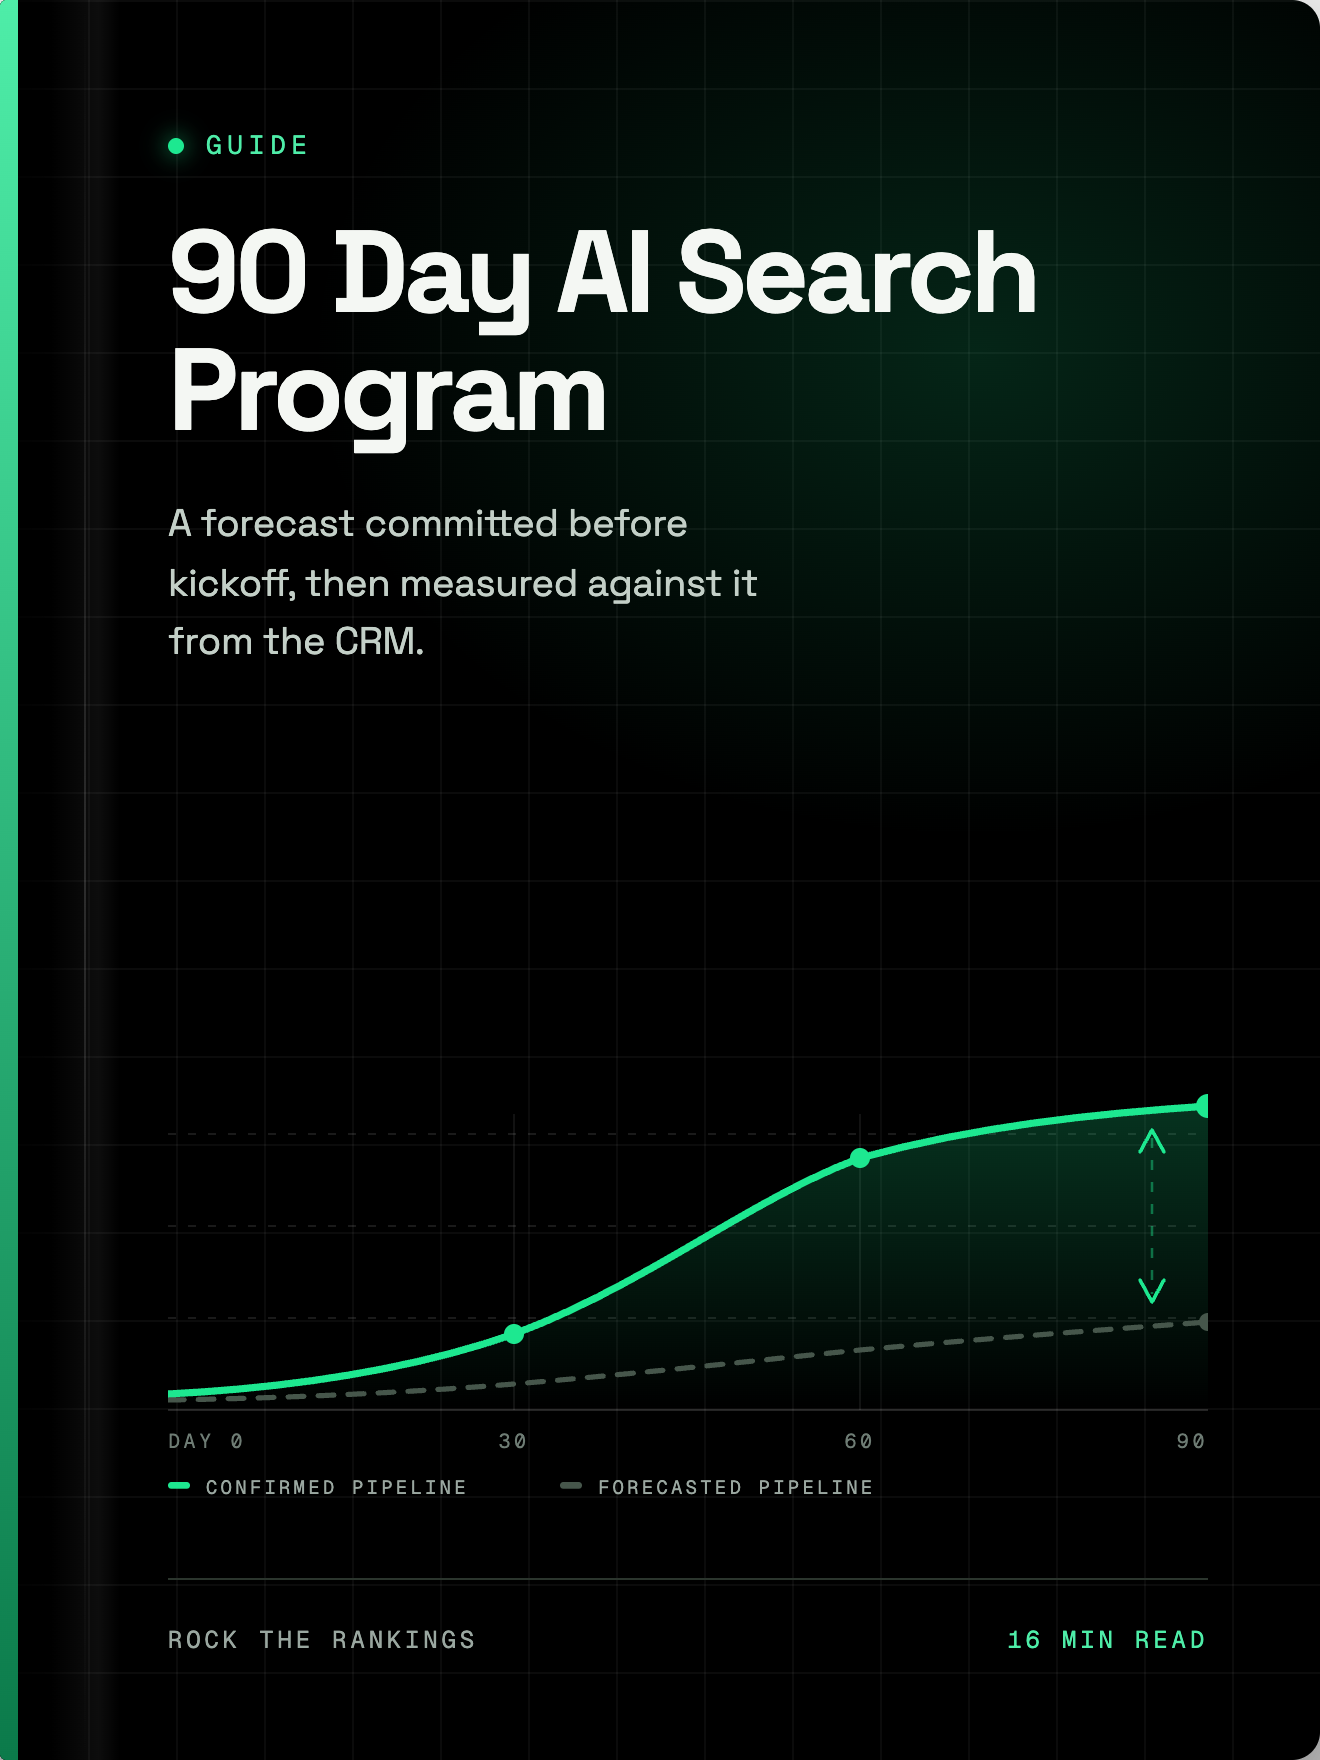
Most AI search case studies show you a visibility chart going up and to the right, and nothing else.
No pipeline. No demos. No answer to the only question that matters: did any of this turn into revenue conversations?
This piece is the opposite. It's the full breakdown of a real 90-day AI search and SEO program we ran for one client, at $8K/month, with the forecast we committed to before work started and the measured results against it.
Every number below comes directly from the client's HubSpot and GA4, not from estimates.
The client is a B2B SaaS company selling into mid-sized and enterprise organizations. Operational buyer, 60 to 120 day sales cycle, an established category with entrenched competitors.
Before the engagement, they had essentially zero bottom-funnel search presence and appeared in about a third of the AI prompts their buyers actually ask.
Here's the exact program we built. The framework, the deliverables, the forecast, what we deliberately chose not to do, and the attribution problem that hides most of this channel's results if you don't know where to look.
Day zero
What success looks like, agreed before day one.
Most AI search engagements fail this step. The agency promises "visibility," the client expects pipeline, and three months in nobody can say whether the program is working.
We built a 12-month forecast model before the engagement started, with two scenarios the client could hold us against.
Scenario one
The Conservative scenario
5% capture of addressable bottom-funnel search volume, converting visits to demos at roughly 1%.
By the end of month 3, that projects around 320 captured BOFU visits and 3 to 4 cumulative demos.
Scenario two
The Realistic scenario
10% capture at a 1.2% visit-to-demo rate.
Around 640 visits and 9 to 10 demos by the same point.
Measurement
Two metrics, both measured directly
Traffic to the new bottom-funnel pages, pulled from GA4. Demos from search and AI buyers, pulled from HubSpot using the "How did you hear about us" field as the source of truth.
That second choice matters more than it looks, and I'll come back to it. Self-reported source data is the only reliable way to see this channel, because the dashboards structurally can't.
Two rows are the contract, two are early warning. Writing this table before work starts is what makes month five a results conversation instead of a definitions conversation.
Do this todaySet the number you agree to be judged on
- 01
Pull the sitewide visit-to-demo rate and the demo-to-close rate off your own GA4 and CRM. Not a benchmark.
SourceGA4 · CRM - 02
Name the addressable bottom-funnel volume, then pick a capture rate. That single lever separates your scenarios.
Output3 scenarios - 03
Choose which scenario is the commitment and write it in the document both sides sign.
Output1 committed number - 04
Declare the measurement instrument per metric, by name, before anything ships.
OutputGA4 · HDYHAU field - 05
Baseline the leading indicators in week one so the month-three delta is real rather than remembered.
OutputWeek 1 baseline
Done whenBoth sides can state the day-90 number, the instrument that measures it, and what counts as a miss.
The framework
Two layers of the GEO Stack.
Our GEO Stack has three layers, built in order.
- Layer 1: Solution-aware presenceThe content AI assistants pull from when answering buying questions. Category listicles, competitor alternatives pages, comparison content. BOFU first, because that's where intent is highest and time to first result is shortest.Deployed
- Layer 2: Citation velocityThird-party mentions in high-authority sources the models already trust. Presence puts you in the conversation. Citation velocity is what makes the model confident recommending you over the incumbent.Deployed
- Layer 3: Problem-aware bridgesContent that connects a buyer's process pain to your product category, so AI brings you into the conversation before the buyer knows the category exists.Deliberately deferred
For this engagement, we ran Layers 1 and 2 only. Layer 3 was deliberately deferred, and I'll explain why in the "what we said no to" section.
Citations pointing at pages that don't exist do nothing. Problem-aware content with no solution-aware foundation sends buyers to a shortlist you're not on.
Layer 1
Fifteen bottom-funnel pages, built in order of intent.
The content plan was 15 BOFU pages. Eight shipped inside the 90-day window, seven more in production behind them.
Every page was net-new. None of these URLs existed before the engagement, which makes the attribution unusually clean: any result from these pages is program-attributable by definition.
01
Category listicles
"Best [category] software" pages for the core category plus the four adjacent categories the client's buyers cross-shop.
These target the exact phrasing buyers use in both Google and AI prompts at the point of decision.
02
Competitor alternatives pages
"[Competitor] alternatives" pages for the three incumbents buyers most often evaluate against.
These are the highest-intent pages on the internet for a challenger brand. Someone searching a competitor's name plus "alternatives" is a buyer with a shortlist and a problem with the leader on it.
03
The prompt map behind the pages
Before writing anything, we mapped 89 tracked AI prompts across seven clusters: category queries, use cases, industries, company sizes, pain points, features, and comparisons.
The pages were built to be the source an assistant cites when answering those prompts, which shapes everything from heading structure to how directly each section answers a question.
Order is intent, not volume. Alternatives pages go first because the buyer reading one has already decided to leave someone.
Outreach starting in week three is the sequencing decision that matters. Links pointed at pages that do not exist yet do nothing.
What the pages did
By the end of the window, the results at the page level:
Layer 2
Twenty-four authority placements at an average DR of 69.
Citation velocity ran alongside the content from month one.
Across the window, we secured 24 links and citations at an average domain rating of about 69, every one pointing at a published bottom-funnel page or the homepage.
This is not link building in the traditional sense. The target list came from the AI side.
We extracted the domains the assistants were already citing when answering the client's 89 tracked prompts, found the overlap with pages ranking for solution-aware keywords, and prioritized the publications the models demonstrably trust.
Outreach led with value: updated data, corrections, genuine inclusions. Not PR pitches.
The effect you're building is mention frequency. Each placement raises the probability the model treats the brand as a credible answer on the next adjacent prompt.
Twenty-four placements, average DR 69, every one pointed at a published bottom-funnel page or the homepage. Nothing pointed at a blog post.
Results
The 90-day scorecard.
Against the forecast both sides agreed to.
Demos At Day 90 · Forecast Vs Measured
6.3 times the Realistic scenario and roughly 17 times Conservative. Of everyone who self-reported Google as their source, 96% booked. Of everyone who self-reported AI search, 100% booked.
Source: Client CRM at day 90, against both committed scenarios
Traffic: 519 captured BOFU visits against 319 Conservative
That's 63% ahead of the cautious scenario and closing on the Realistic line of 638.
And this number understates reality, because GA4 can't see most AI-referred visits. More on that below.
Demos: 59 against a Realistic forecast of 9.4
Fifty-nine buyers who named Google Search or AI Search on the intake form booked a demo inside the window.
That's 6.3 times the Realistic scenario and roughly 17 times Conservative. Of everyone who self-reported Google as their source, 96% booked. Of everyone who self-reported AI search, 100% booked.
Those two rows are the contract metrics. Underneath them, the leading indicators that drive the next two quarters.
AI citation rate went from 33% to 47%
Across the 89 tracked prompts, the client's own content is now cited as a clickable source in 47% of AI answers, up 13 points from baseline, with 56 of 89 prompts improving.
The gains concentrated exactly where we published: the competitor alternatives clusters jumped between 35 and 59 points, with the best cluster going from 23% cited to 82% cited.
Buyers naming Google as their source rose 159%
From 22 to 57 versus the prior 105 days.
Counting AI search alongside, the two channels became the single largest named source of inbound.
AI-sourced buyers were the highest quality in the funnel
Of the buyers who named AI search, 8 of 9 reached MQL or beyond. An 89% qualification rate, roughly double the inbound baseline.
This matches what we see across our client base: AI search delivers a fraction of the volume of Google and several times the intent, because the buyer arrives having already received a recommendation.
Attribution
The part every dashboard gets wrong.
Here's the section that justifies the parenthetical in the title.
During the window, 13 buyers explicitly told the client they found them through AI search. The number HubSpot machine-tagged as AI: 2.
What The Dashboard Could See
The gap is structural, not a settings error. HubSpot builds its source field from the referring URL, and AI assistants strip it, so the visit lands as Direct. The same distortion hits Google, just less severely.
Source: HubSpot contact records, machine tags against buyer self-reports
That's not a settings error. It's structural.
HubSpot builds its source field from the referring URL. When ChatGPT, Perplexity, Gemini, or Claude sends a buyer, the referrer is stripped, so the visit arrives with no source data and gets logged as Direct.
The same distortion hits Google: 73 buyers named Google on the form against 43 the dashboard tagged as organic.
There's a second-order effect that's even sneakier. Buyers who see a brand recommended in an AI answer often don't click at all.
They remember the name, then come back later by typing the brand into Google or going direct. That behavior gets logged as branded search or Direct traffic, and Direct sessions rose about 14% during the engagement. The downstream signature of upstream AI mentions.
So the operating rule we use with every client: treat the dashboard numbers as a floor, treat form self-reports as the recovered signal, and build the reporting around the gap between them.
Without it, this entire channel is invisible, and you'll conclude a working program is failing.
Do this todayMake this channel visible before you judge it
- 01
Add the open-text source field to the demo form. Without it this program reads as a failure at day 90.
CostOne form field - 02
Report machine-tagged and self-reported side by side, both labelled, in every deliverable.
OutputRaw + recovered pair - 03
Filter GA4 to the net-new URLs only. Mixing them with legacy pages destroys the attribution you built on purpose.
OutputProgram-only view - 04
Re-measure the tracked prompt set on the same day each month. Same prompts, same platforms, same time of day.
CadenceMonthly
Done whenThirteen buyers naming AI cannot show up in your dashboard as two.
Restraint
What we deliberately said no to.
The program is defined as much by what we didn't do.
01
No Layer 3 at launch
Problem-aware content is the biggest layer of the stack, and it went last on purpose.
Not every problem prompt bridges to a product recommendation; some return pure process advice. Until Layers 1 and 2 are producing, problem-aware content is a bet without a foundation.
It enters the roadmap now that the BOFU engine is proven.
02
No TOFU content
Across our client base, top-of-funnel informational content converts below 0.2% under AI search conditions, because the assistant answers the question completely and the buyer never sees the brand.
Every content dollar in the first 90 days went to pages that answer buying questions.
03
No programmatic content at scale
The "publish 500 AI-generated pages" playbook is the fastest way to teach the models your domain is noise.
Fifteen pages, each built against a mapped prompt set, beat five hundred pages built against nothing.
04
No llms.txt files or AI-specific sitemaps
No schema tricks or embedding hacks sold as strategy either.
After 12 months of testing across 20+ B2B SaaS campaigns, our read is consistent: those tactics are rounding errors until BOFU presence and citation velocity are in place. Do the boring work first.
05
No waiting for "AI traffic" in analytics as the proof metric
For the structural reasons above, that number will always read near zero even when the channel is working.
Programs that report on it get killed for the wrong reason.
What follows
Days 90 to 180.
Everything above is a proven starting point, not a finished machine.
01
Finish the BOFU set
The remaining seven pages close out the comparison and alternatives gaps. Then attention shifts to the highest-value product and industry pages.
02
Sustain citation pace
Eight-plus placements a month, converting the pending pipeline to live links. Citation gains compound; the clusters that jumped 40+ points did so on the back of consistent monthly velocity, not a one-time push.
03
Run the next ideation round
Re-map the keyword and prompt landscape to find the next wave of solution-aware terms worth owning before a competitor does.
04
Watch the conversion lag close
Citations and rankings lead; demos follow by roughly four to eight weeks. The visibility earned in the last month of this window converts in the next one.
That last point is the honest caveat every AI search vendor should give you. This channel compounds, which means the early window understates the steady state.
But it also means the brand that builds the citation base first becomes exponentially harder to displace. Every month you're not the cited answer, someone else is training the model that they are.
The takeaway
Hold any program to this standard.
At $8K/month, the program delivered 519 measured BOFU visits, 59 demos from search and AI buyers against a forecast of 9, a citation rate that went from one in three prompts to one in two, and an AI-sourced buyer cohort qualifying at 89% MQL+.
None of it required a secret.
It required sequencing (presence before citations, citations before expansion), restraint (no TOFU, no programmatic volume, no tactic chasing), and an attribution setup honest enough to see the channel at all.
We run AI search and SEO programs exclusively for B2B SaaS companies. If you want a senior operator to audit your category's AI search landscape, map the prompts that matter for your ICP, and hand you a prioritized 90-day plan, let's talk.